Peta NASA Ungkap Jawa sebagai Pulau Terpadat di Dunia
Map Shows Half the Planet`s Population Lives on Just 1% of Its Land
Editor : Cahyani Harzi
Translator : Dhelia Gani
DARATAN menutupi 196.900.000 mil persegi dari planet kita, yang terbagi menjadi 196 negara yang merupakan rumah bagi 7,125 miliar penduduk. Pulau Jawa di Indonesia merupakan pulau yang paling padat penduduknya di dunia, yang dihuni 140 juta orang.
Dengan begitu banyak daratan yang tersedia di Bumi yang dipikir banyak orang tersebar merata di seluruh dunia - tapi peta baru yang luar biasa mengungkapkan bahwa hal itu tidak terjadi.
Seorang pengusaha menggunakan data dari NASA untuk memahami di mana sebagian besar penduduk dunia tinggal dan menemukan setengah dari kita yang hidup berdesakan di daratan yang hanya satu persen dari luas dunia.
Max Galka, salah satu pendiri dari bisnis data real estate, menyusun informasi dari data populasi grid dari NASA, yang mengumpulkan informasi tentang populasi manusia berdasarkan wilayah geografis, untuk membuat peta yang informatif.
'Data Populasi grid membagi populasi dunia menjadi grid sel berbentuk persegi kecil, tanpa memperhatikan batas administrasi negara,' menurut blog Galka.
Untuk penelitian ini, grid terdiri dari 28 juta sel, masing-masing berukuran sekitar 3 mil dari 3 mil.
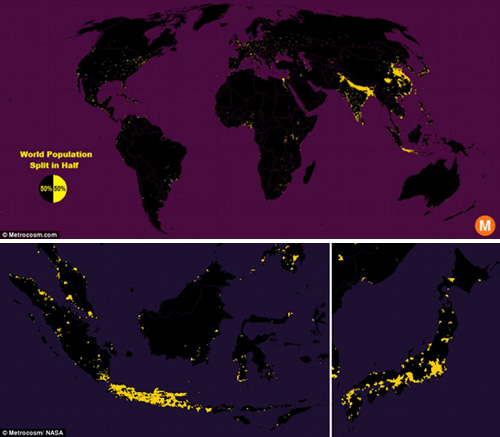
Dari 28 juta sel, yang mengungkap populasi lebih dari 8.000 berwarna kuning, yang berarti pada daerah-daerah tertentu kepadatan penduduknya sekitar 900 orang untuk setiap mil persegi.
Galka menjelaskan ini adalah 'kira-kira kepadatan penduduk yang sama dengan negara bagian Massachusetts.'
Daerah hitam di peta mencerminkan sebaliknya, dengan populasi kurang dari 8.000 orang dan kurang dari 900 orang per mil persegi.
Dunia ini terbagi rata antara kuning dan hitam, tetapi peta yang menunjukkan warna kuning hanya satu persen dari permukaan bumi.
Menurut PBB, mayoritas pertumbuhan populasi dunia akan terjadi di Afrika pada 2100.
Dan peta menunjukkan, Afrika memiliki banyak ruang untuk manusia untuk bermukim dan hidup nyaman.
'Afrika Utara sebagian besar tanpa zona padat penduduk, dengan satu pengecualian saja," jelas Galka.
"Peta ini dibangun berdasarkan pada grid penduduk dunia terdiri jutaan sel kecil, masing-masing berukuran sekitar 3 mil kali 3 mil. Di seluruh dunia, sel dengan populasi terbesar berada di Kairo.'
Daerah, yang terukur hanya 9 mil persegi, di mana lebih dari satu juta orang hidup.
Ada area kuning besar di tengah yang seukuran New York State dan merupakan rumah bagi lebih dari 100 juta orang.
Daerah yang sangat padat di Asia berada di kawasan perkotaan.
Pulau Jawa di Indonesia adalah pulau yang paling padat penduduknya di dunia, karena merupakan tempat bermukim bagi 140 juta orang dan tingkat kepadatannya setara dengan New York.
Jepang adalah di urutan kedua sebagai pulau terpadat di dunia, tetapi sebagian besar wilayahnya adalah kawasan perkotaan.
Ada 37 juta orang yang tinggal di Tokyo, padahal luasnya hanya sekitar 845 mil persegi.
'Meskipun tidak memiliki kepadatan penduduk seperti di Asia, di Eropa ternyata berbeda dengan Asia,' menurut Galka.
'Berbeda dengan pusat-pusat populasi sangat terkonsentrasi di Asia, daerah padat Eropa tersebar sangat merata di seluruh benua.'
Ini tidak mengherankan bahwa Amerika Serikat negara adalah padat penduduk, tetapi peta menunjukkan setengah dari penduduknya hidup di pedesaan dan setengah lainnya bermukim di kota.
Setengah dari penduduk negara itu bermukim di kawasan Timur Laut, Selatan, dan kota-kota di kawasan Barat.
AS pada dasarnya adalah versi lebih kecil dari peta dunia Galka, karena itu mencerminkan dunia dengan pola yang penduduknya dibagi: satu setengah dikemas di daerah kuning kecil, setengah lainnya tersebar di hamparan hitam.
PBB merilis sebuah studi, yang memperkirakan populasi global akan mencapai 11 miliar pada akhir abad ini - dan Afrika akan dihuni oleh setengah dari jumlah tersebut.
Pada 2050, populasi global akan naik menjadi 7,3 miliar orang ke 9,7 miliar dan pada 2100, populasi di Afrika saat ini dari 1,2 miliar diperkirakan akan meledak menjadi 5,6 miliar.
Para ahli memprediksi pertumbuhan yang cepat tersebut akan meningkatkan polusi, membuat sumber daya alam khususnya bahan bakar semakin langka, pengangguran, kemiskinan, kejahatan dan kerusuhan politik.
Prediksi yang dibuat oleh John Wilmoth, direktur Divisi Kependudukan PBB, pada Rapat Gabungan Statistik di Seattle.
Di AS, pertumbuhan penduduk diproyeksikan meningkat 1,5 juta orang per tahun rata-rata sampai akhir abad ini, mendorong jumlah saat ini 322 juta ke 450 juta.
Sementara Asia, dengan populasi saat ini 4,4 miliar, diperkirakan akan mencapai puncaknya sekitar pertengahan abad ini pada 5,3 miliar, dan kemudian menurun menjadi sekitar 4,9 miliar.
Proyeksi PBB menunjukkan tidak akan ada mengakhiri pertumbuhan penduduk dunia abad ini kecuali 'belum pernah terjadi sebelumnya penurunan kesuburan' di bagian sub-Sahara Afrika yang masih mengalami pertumbuhan penduduk yang cepat.
Dan itu memperkirakan probabilitas pertumbuhan populasi dunia akan berakhir dalam abad ini menjadi 23 persen seperti dilansir MailOnline.
LAND COVERS 196.9 million square miles of the planet, which is broken up into 196 countries that are home to 7.125 billion people.
With so much land available on Earth you would think people are spread out evenly throughout the world - but a stunning new map reveals that isn't the case.
An entrepreneur used data from Nasa to understand where most of the world’s population resides and found half of us are crammed into just one percent of the world.
Max Galka, co-founder of a real estate data business, compiled the information from Nasa’s gridded population data, which organizes populations based on geographic regions, to create an informative map.
‘The gridded population data divides the world population into a grid of tiny square-shaped cells, without regard for administrative borders,’ according to Galka’s blog.
For this research, a grid comprised of 28 million cells was used, each one measuring roughly 3 miles by 3 miles.
Out of the 28 million cells, the ones with a population over 8,000 are coloured in yellow, which means those areas have a population density of about 900 people for every square mile.
Galka explains this is ‘roughly the same population density as the state of Massachusetts'.
The black areas in the map reflect the opposite, with populations less than 8,000 people and less than 900 people per square mile.
The world is evenly split between the yellow and the black, but as the map shows the yellow is only one percent of the Earth’s surface.
According to the United Nations, the majority of the world’s population growth will occur in Africa by 2100.
And as the map indicates, Africa has a lot of space for people to live and live comfortably.
‘North of Africa is largely devoid of dense population zones, with one major exception,’ explained Galka.
‘This map was constructed based on a world population grid made up millions of tiny cells, each one measuring about 3 miles x 3 miles. In all the world, the cell with the largest population is located in Cairo.’
The area, which measures only 9 square miles, is where more than a million people live.
There is a large yellow area in the center that is about the size of New York State and is home to more than 100 million people.
The highly populated areas in Asia are located in inland urban areas.
The Island of Java in Indonesia is the most populated island in the world, as it is home to 140 million people and also the same size as New York.
Japan is runner up for largest island in the world, but is home to the largest metro area.
There are 37 million individuals living in Tokyo, which is just about 845 square miles.
'Though it does not have nearly the population density of Asia, Europe is exceptional for its lack of open space,' according to Galka.
'Unlike the heavily concentrated population centers of Asia, Europe’s dense areas are spread out remarkably evenly across the continent.'
It’s no surprise that the United States is heavily populated, but a the map shows half of its residents live in spread out areas and the other half pack themselves in cities.
Half of the country's residents call Northeastern, Southern, and Western cities home.
The U.S. is basically a smaller version of Galka's world map, as it mirrors the world in the way its population is divided: one half packed in the small yellow regions, the other half spread out across a black expanse.
The United Nations released a study this past August, which predicts the global population is set to reach 11 billion by the end of the century - and Africans will make up half of this number.
By 2050, the global population will rise from 7.3 billion to 9.7 billion and by 2100, Africa’s current population of 1.2 billion is expected to explode to 5.6 billion.
Experts predict such rapid growth will boost pollution, make resources scarce and fuel unemployment, poverty, crime and political unrest.
The predictions were made by John Wilmoth, the director of the United Nations Population Division, at the 2015 Joint Statistical Meetings in Seattle.
His presentation, 'Populations Projections by the United Nations', was made as part of the session titled 'Better Demographic Forecasts, Better Policy Decisions'
In the US, the population is projected to add 1.5 million per year on average until the end of the century, pushing the current count of 322 million to 450 million.
While Asia, with a current population of 4.4 billion, is expected to peak around the middle of the century at 5.3 billion, and then decline to around 4.9 billion.
The UN projection suggests there will not be an end to world population growth this century unless there are 'unprecedented fertility declines' in parts of sub-Saharan Africa that are still experiencing rapid population growth.
And it estimates the probability the world population growth will end within this century to be 23 per cent.